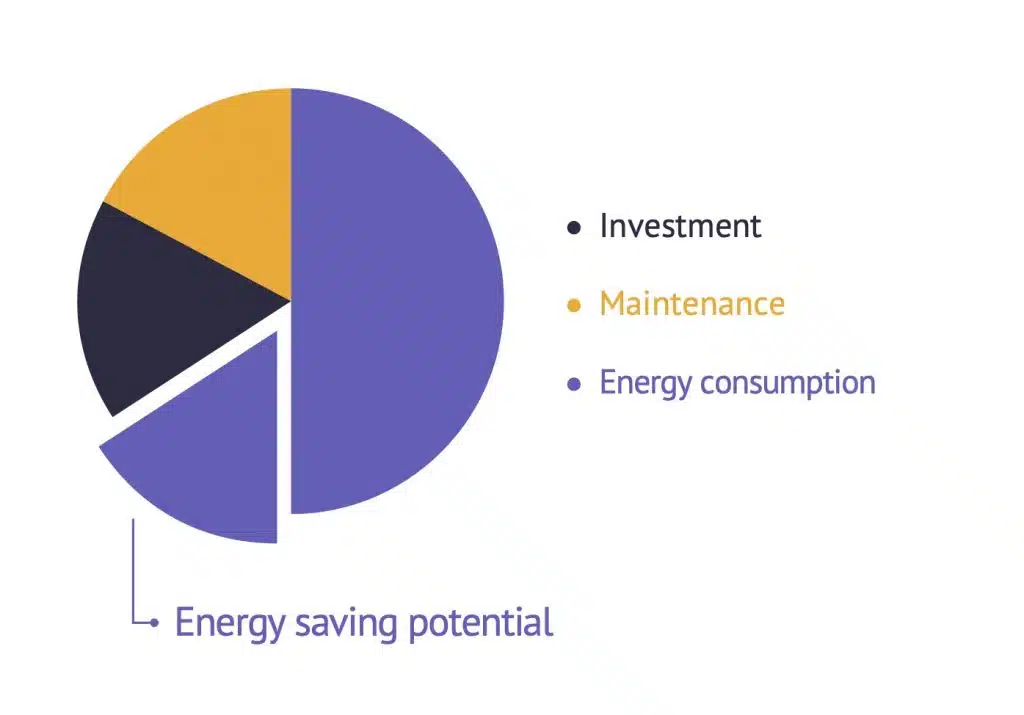
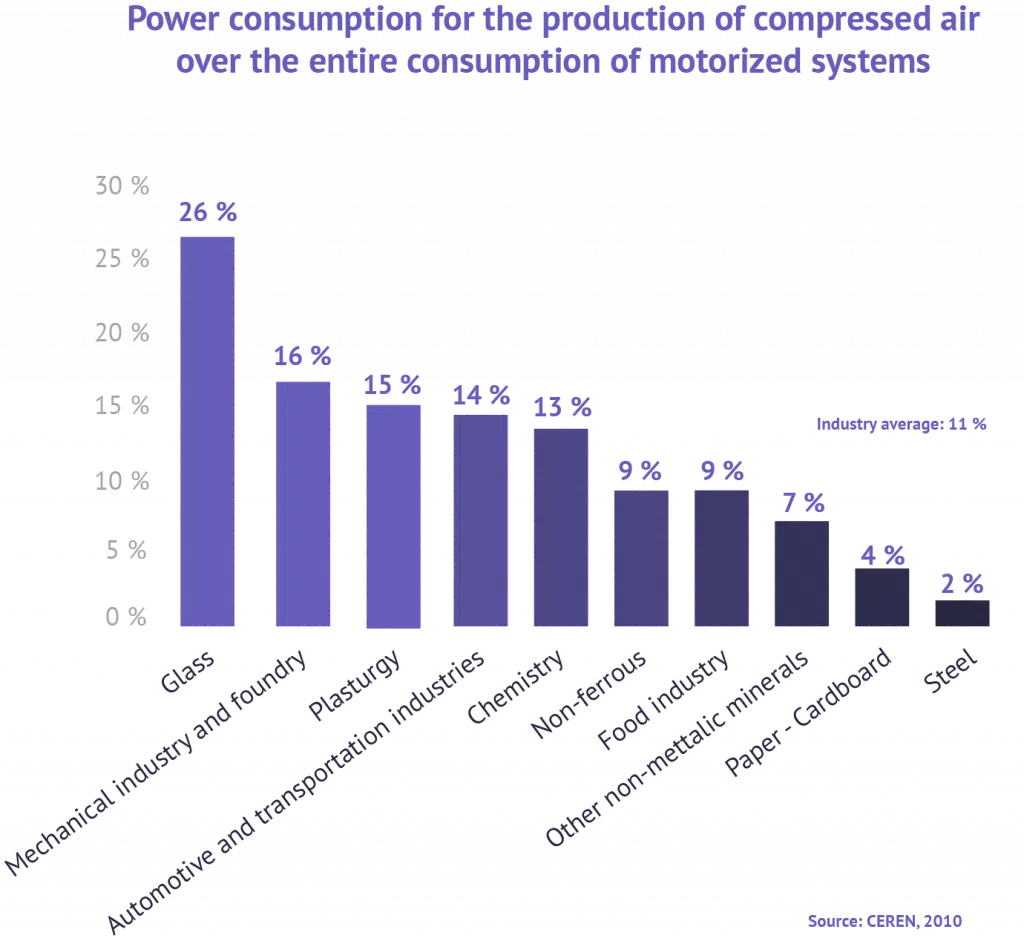
In the industrial sector, compressed air uses 5 to 10% of electricity consumption. This is true for almost all industrial sectors: steel, glass or cement production, food processing and so on. This is why it is a good idea to look into monitoring and optimizing its production and consumption. What advantage does digitalization have for optimizing an installation? Let's take a look in this article.
Compressed Air: Production and Applications
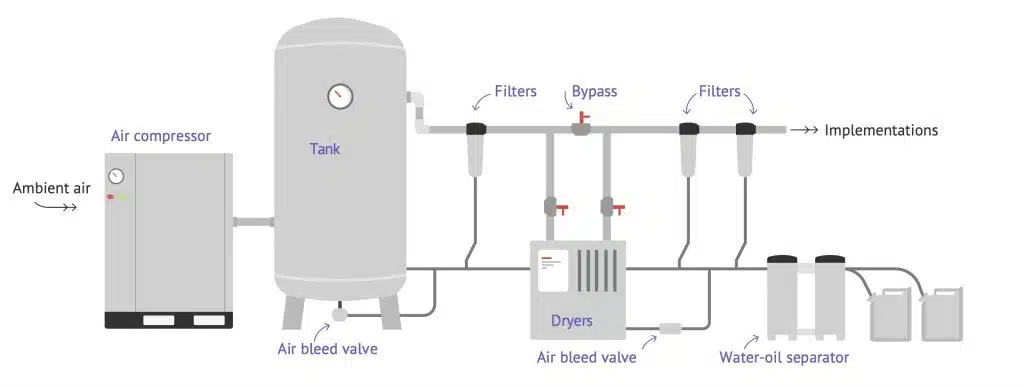
Compressed Air Production
Did you know that 90% of a compressed air network’s energy consumption comes from its compressors? This equipment consumes a lot of energy and so is of particular interest. However, other equipment that are often needed (dryers, filters, tanks etc.) should not be ignored.
These components generate a large amount of data that has to be collected. This data give us a better understanding of the compressor room and the compressed air demand. Combined with energy engineer skills it can be valuated to monitor the system, detect opportunities and improve the energy efficiency. Using digitalization, combined with the skills of energy engineers, monitoring then optimizing industrial compressed air equipment can be a significant vector for improving energy performance.
What Type of Consumption?
The air produced has various types of uses:
- Process air, usually mixed with a product for cleaning, sanding, microbead blasting, cryogenics (CO2 based), and spray-painting and humidification:
- Spray booths,
- Plastic processing (plastic bottle blowing machine),
- Bottling.
- Pneumatic command and control of automated robots, especially in the textile, print or packaging industries.
- Using venturi suction cups equipping assembly lines for the production of metals and aluminum, as well as in the timber and plastics industry, and the medical field.
- Transporting powdered and granulated products, especially in the cement sector or cereals industry.
- Manufacturing container glassware requiring significant air outputs for shaping the product.
AN EMOS solution enables to cover the compressed air production and also the air consumption to provide a complete management of this vector. This improves production efficiency, distribution and end uses of all types. Production and consumption are taken into account in order to completely optimize the compressed air system.
Big Data and Artificial Intelligence
How Do We Monitor and Optimize Compressed Air Production and Processes Thanks to Digitalization?
One of the issues with compressed air is being able to optimize energy consumption without affecting the processes whilst supplying the demand and ensuring the air quality (pressure, humidity, etc.).
What data has to be collected for compressed air?
- The electricity consumption of the compressor room,
- The compressed air flow rate,
- Flow rate of main consumers or networks (if available),
- The quality of the air (pressure, humidity, etc.) leaving the production plant and in the network,
- The conditions of the exterior air (humidity, temperature and pressure).
This compressed air digitalization process is usually done in 3 stages, depending on the development of the site and the data available.
Collecting historical data first can help speed up the process. It provides a more representative image of how the air production plant and consumer units operated in the past. However, as these systems are stable, it is possible to obtain representative KPIs after a few months of observation even without historical data.
1. Basic monitoring
The first stage, setting up a reporting system and choosing good KPIs, enables the granularity of the monitoring system to be improved, saving time and providing greater visibility of uses, in particular, breaking them down into different scopes. Although simple, this part already provides a wealth of information. It facilitates the control of consumption and provides more transparency within the factory.
2. Advanced monitoring
Some solutions, such as an EMOS, allow to cross the electric consumption with all the influent parameters. This method, based on ML algorithms, allows users to verify that the electricity consumption is normal in the current context (of air demand, pressure, temperature, etc.). This method is more accurate than KPI to spot inefficient periods, drifts or to measure savings after an optimization. Cross-referencing the data from the factory and from the exterior with the air production plant (workshop production, meteorological conditions, etc.) enables accurate reference models with a good granularity to be built. What added value is there? The advantage of rapid alerts if there are any discrepancies, enabling consolidation of the savings during energy efficiency projects.
3. Optimization
The final key stage of this process is optimization. Cross-referencing all the data monitored with the industry knowledge bases enables energy efficiency projects to be identified and evaluated. Modelling methods, integrating industry skills and the power of optimization algorithms can be added to this to produce simulations so that potential savings can be quantified.
Some tangible examples of optimization:
- Finding the most efficient activation rules (priorities, thresholds) to supply the demand and reduce the electricity cost (optimal sequencing),
- Detecting and assessing the standard opportunities (variable speed compressor installation, modifying the pressure setpoint, de-clogging filters, etc.),
- Detecting leaks and abnormal uses,
- Simulate other configurations of the production plant (for example, replacing a compressor, adding buffers, etc.).
METRON Use Case
Context:
A brewery in Asia with beer production of around 4000 k hl per year.
Annual consumption of the factory:
- Electricity: 42 Gwh per year (10% of which is for the compressed air system),
- Liquid Natural Gas: 10000 k NM3 per year,
- Energy bill: $12m per year.
Scope:
Compressed air system.
Targets:
The customer’s first challenge was to digitize and improve the factory’s energy management. Another issue was to propose anew sequencing for the compressors enabling the demand for compressed air to be maintained whilst minimizing consumption and so optimizing costs.
Actions:
Thanks to the METRON solution, the teams changed the sequencing to real time so as to reduce costs whilst remaining the same production volume.
Range of services provided:
- Managing consumption performances and leaks,
- Clogged filter alerts,
- Sequencing and optimizing the compressed air system,
- Changing the sequencing so as to meet demand at the least cost,
- Modelling and forecasting the dew point,
- Defining a KPI for each production plant and total air production,
- Evaluating the return on investment in a new dryer that minimizes compressed air waste.
Results:
Advanced monitoring, real time alerts, sequencing and optimization that enabled the following to be achieved:
- Savings made: 2% per year, Potential: 4.1% per year, which is a total of 256 MWh,
- 2 man-days saved per month,
- a potential 256 MWh less electricity consumed, which corresponds to a reduction in greenhouse gas emissions of 136 tonnes of CO2 per year.
Manufacturers can now count on digitalization to have a smart management of energy in their production sites. A global approach allow to cover compressed air but also other utilities (cooling, HVAC, steam, etc) and industrial processes.
What is the objective? To be able to visualize and to control their energy consumption over time, using a monitoring tool that can be upgraded and adapted to their level of development. The system, if operated and maintained at its optimum performance on a daily basis, is also able to assess changes in scope and to actively look for optimizations in consumption and air production, so as to make energy savings and gain in competitiveness. Are you ready for digitalization at your factory?
Want to learn more about Energy Management & Optimization Systems (EMOS)?


